
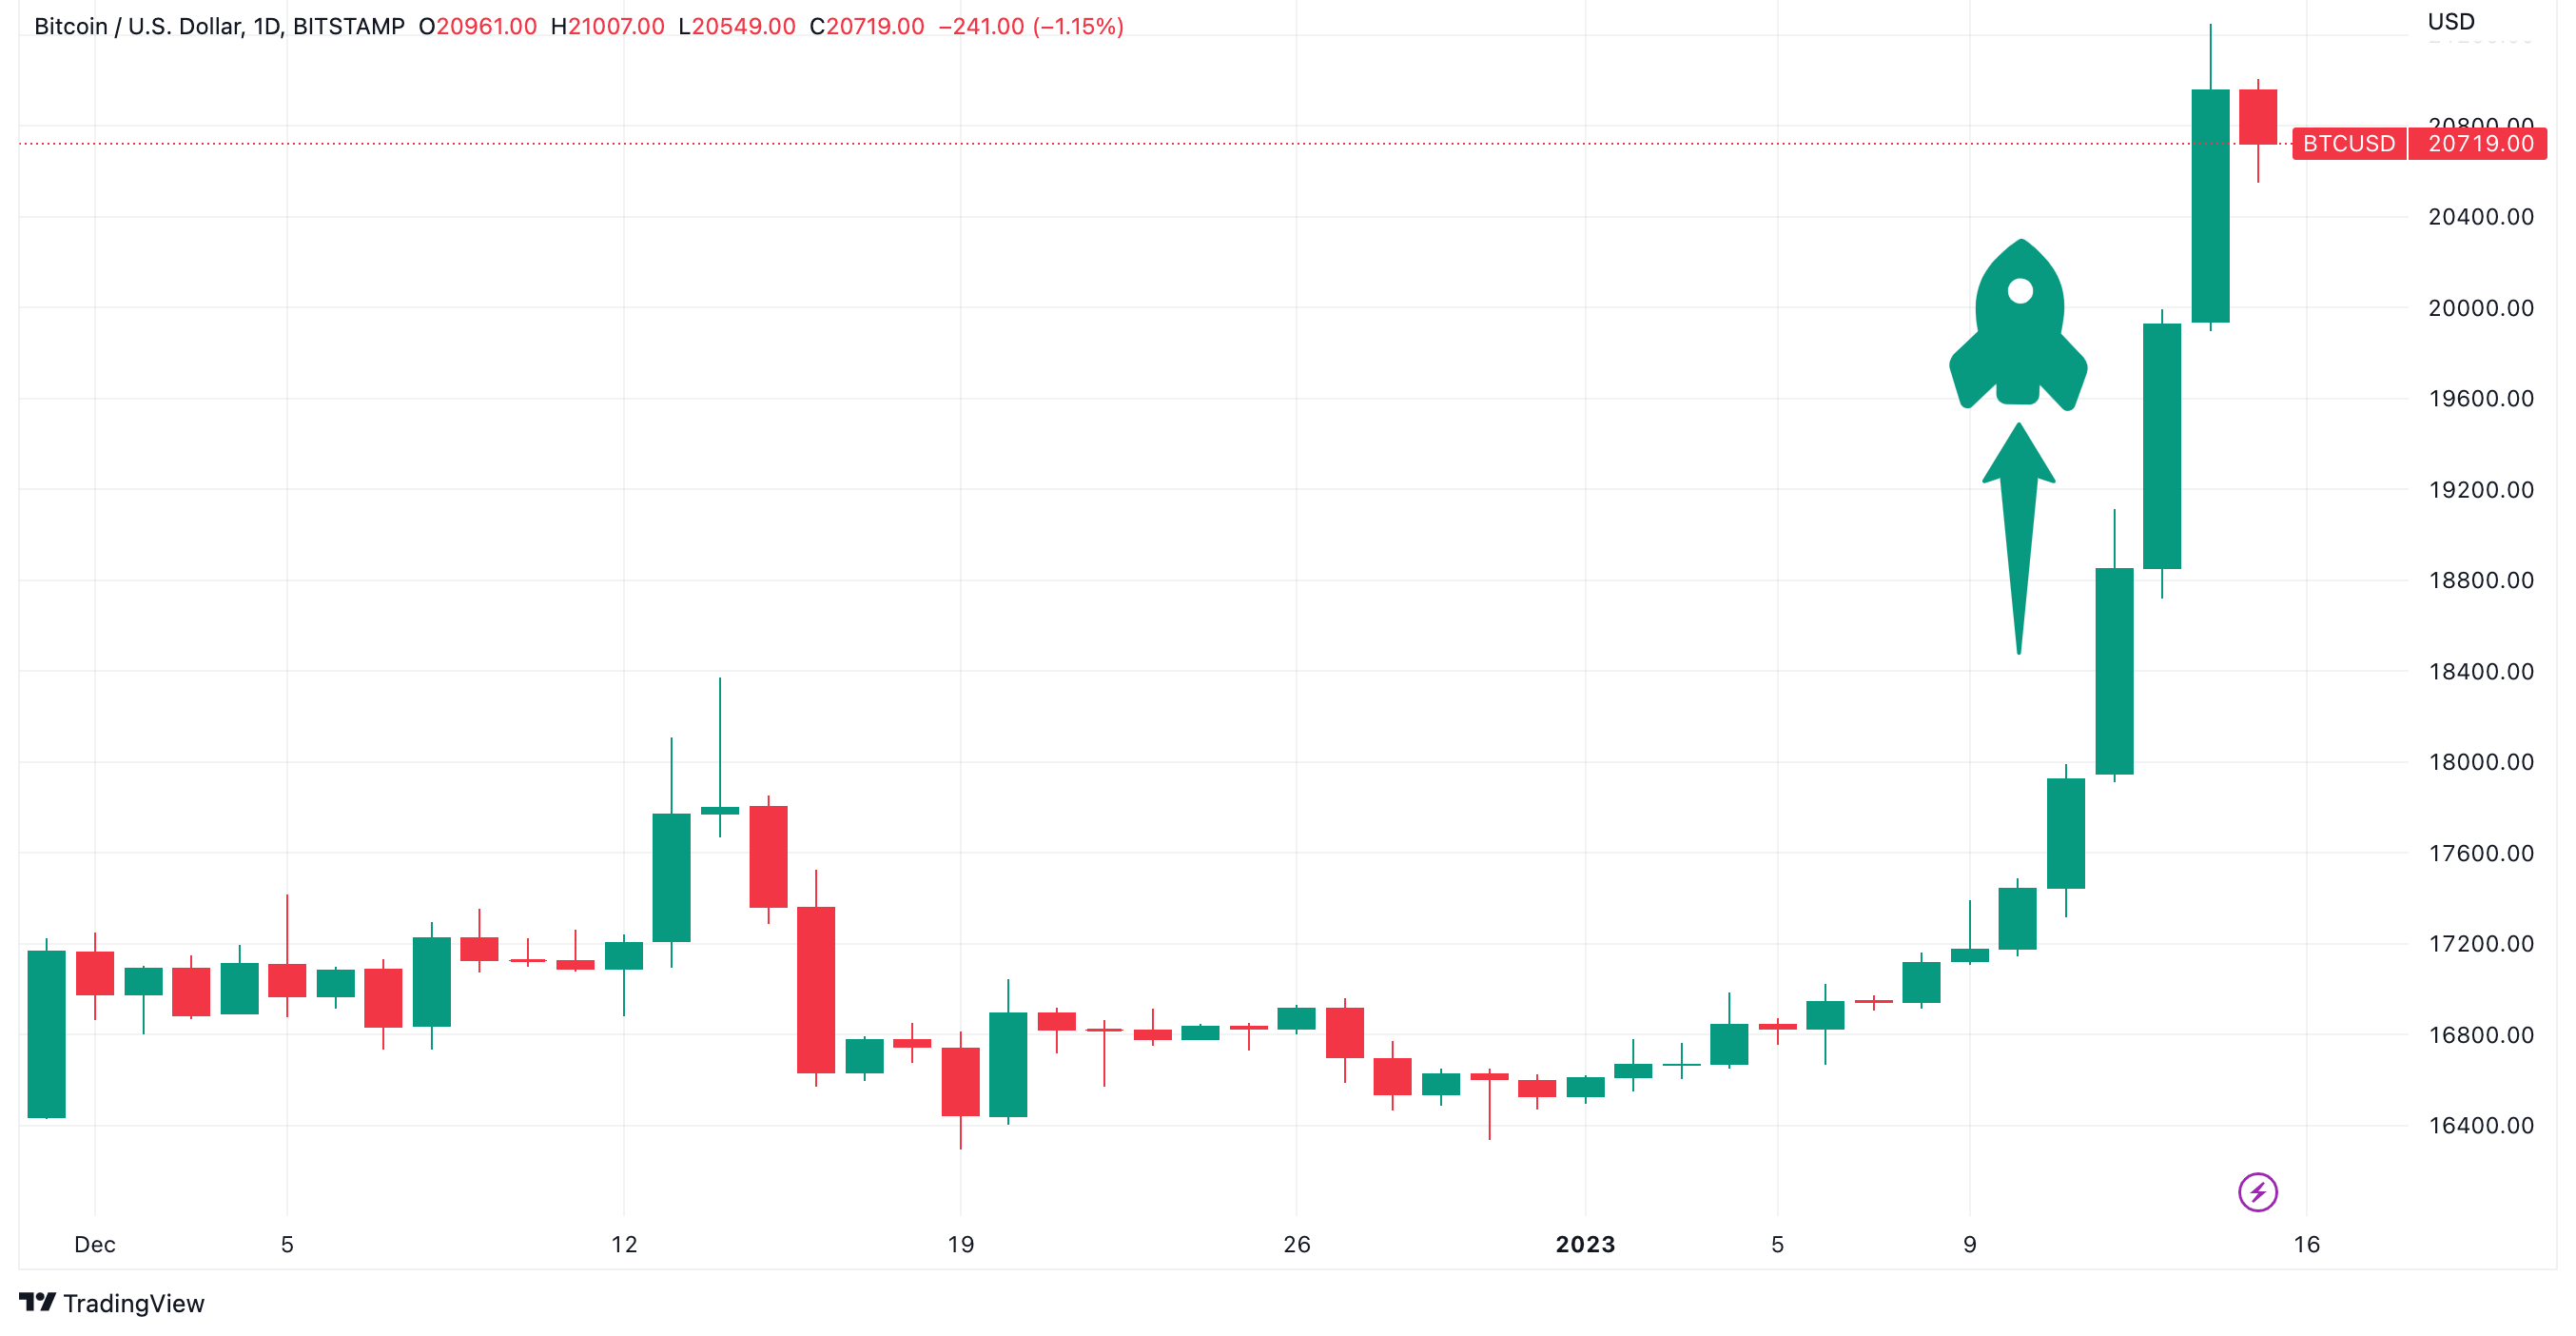
The BTC price has been on a parabolic tear upward over the last 2 weeks with the largest green candles coming in the last few days.
Why has price been pumping so hard? There may be many reasons for this parabolic pump –
- Positive CPI data
- The DXY (dollar index) continues to fall
- Crypto assets may have been massively oversold
Positive CPI Data
The recent rally in crypto prices may have been triggered in part by the release of a positive Consumer Price Index (CPI) report which showed a decrease in overall inflation for consumers by 0.1%. This decrease in inflation is the largest seen since April 2020. Traders in equities markets have also been positively impacted by this news and have driven prices higher on the expectation that the positive data may lead to less aggressive interest rate hikes by the Federal Reserve at the upcoming Federal Open Market Committee (FOMC) meeting on February 1st, 2023.
The DXY (US Dollar Index) Continues to Fall
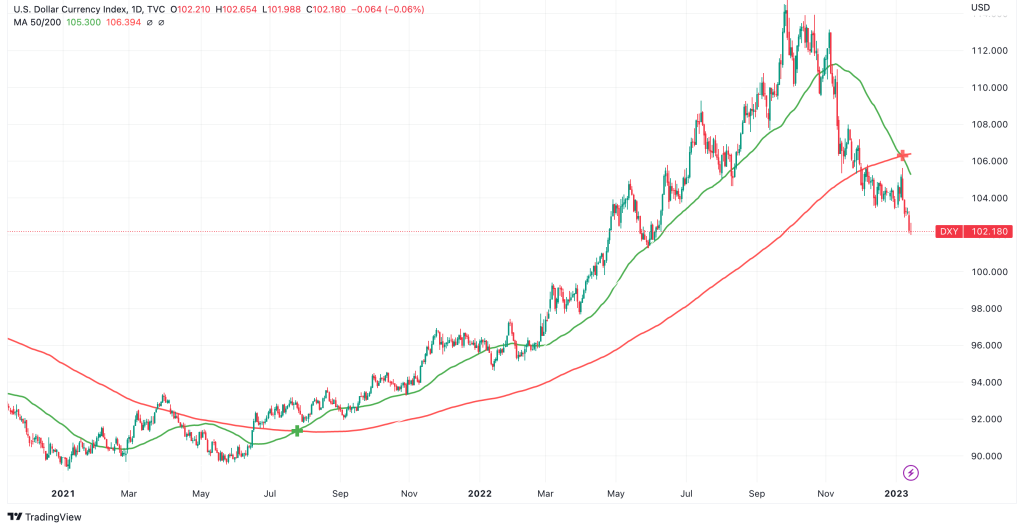
The 50-D MA and 200D-MA have formed a death cross on the DXY daily chart. This has caused risk assets to rally.
Crypto Assets May Have Been Massively Oversold
As you can see from the BTC monthly RSI (relative strength index), BTC was, and still is, in a range of being its most oversold ever!
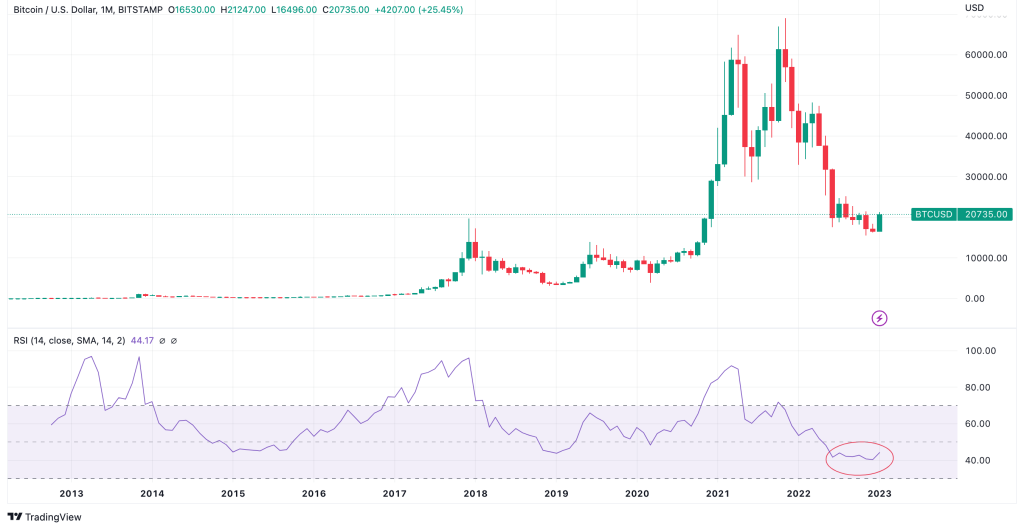
After experiencing a significant decline of 80% from its peak value, BTC has seen some investors taking advantage of discounted prices and buying up coins. Similarly, leading altcoins have also seen steep drops of up to 99% from their all-time high prices! Raising the question of whether this is an opportunity for investors to purchase at lower prices.
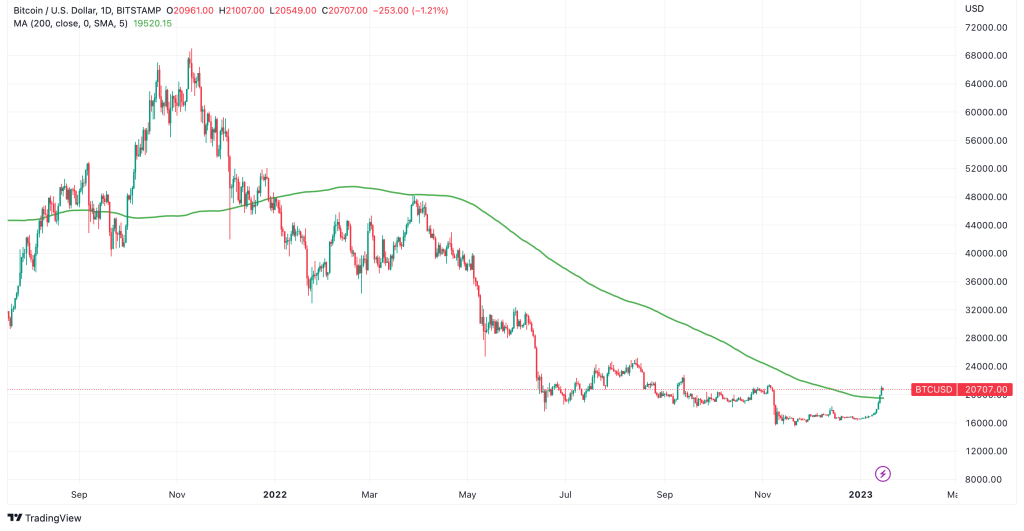
Moving Averages Very Positive
The 200-day MA and 21-week EMA are two of THE most important moving averages for BTC. Historically, when BTC price is above these moving averages, it is in a bull market. And when price is below these moving averages, BTC is in a bear market.
One would have expected these 2 major moving averages to have put up some resistance but BTC simply smashed through both of them in a parabolic upward move! Many analysts would see this as very positive for the BTC price.
BTC is above the 21-W EMA (blue line) for the first time since April 2022 (8 months)
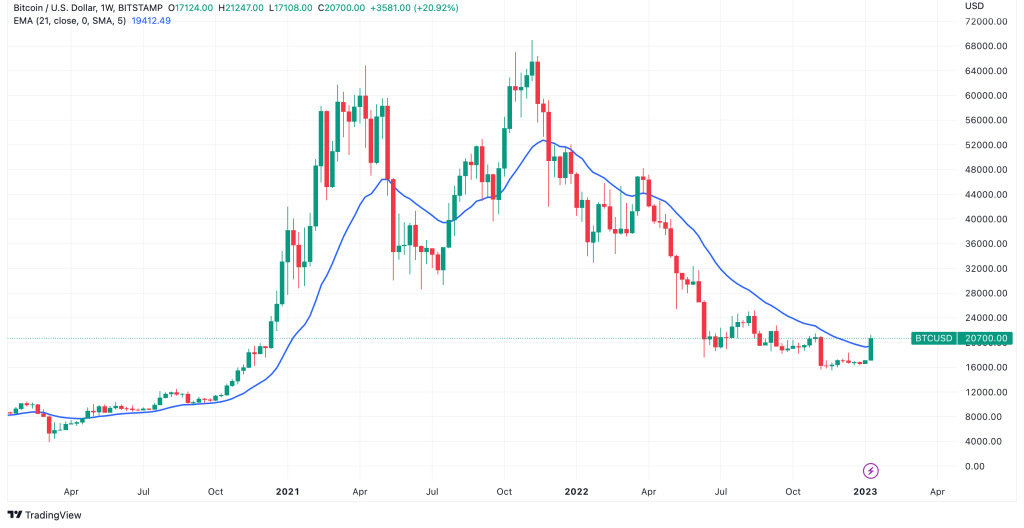
BTC is now above the 200-D MA (green line) for the first time since December 2021 ( first time in 14 months)
What Do Leading TA Analysts Think?
If BTC can hold and confirm above both the 21-W EMA and the 200-D MA then that will be a very positive sign. If not, new lows may be coming.
What do you think happens next?
Written by JayXBT